How to Measure Ad Performance
ROAS or CPA — which one should you optimise for? It is one of the most asked and most badly answered questions in digital marketing, because most businesses judge performance by the handful of metrics they see in the dashboard alone: ROAS, CPA or conversion count. If the reports look good, they assume the ads are working too. The truth is usually more complicated.
Digital ad investment is at the biggest scale in its history. Global digital ad spend is expected in 2026 to reach $1.25 trillion and by 2030 more than 82% of total ad spend will happen in digital channels. So companies shift a bigger budget to Meta, Google, TikTok and other platforms every year.
But the critical question does not change:
Are these ads actually producing profit, or only traffic and a sales report?
Because digital ad dashboards usually show you revenue, not profitability.
A campaign might be producing a ROAS of 4.
But once product cost, shipping, commission, returns and operating expenses are counted, that same campaign may actually be losing money.
In the same way, many businesses mistake CPA for a success metric. Yet the cost of a first purchase and customer acquisition cost (CAC) are not the same thing. If customers do not buy again, or LTV is low, even a good-looking CPA can make growth unsustainable.
This is exactly why, to understand ad performance, a single metric is not enough.
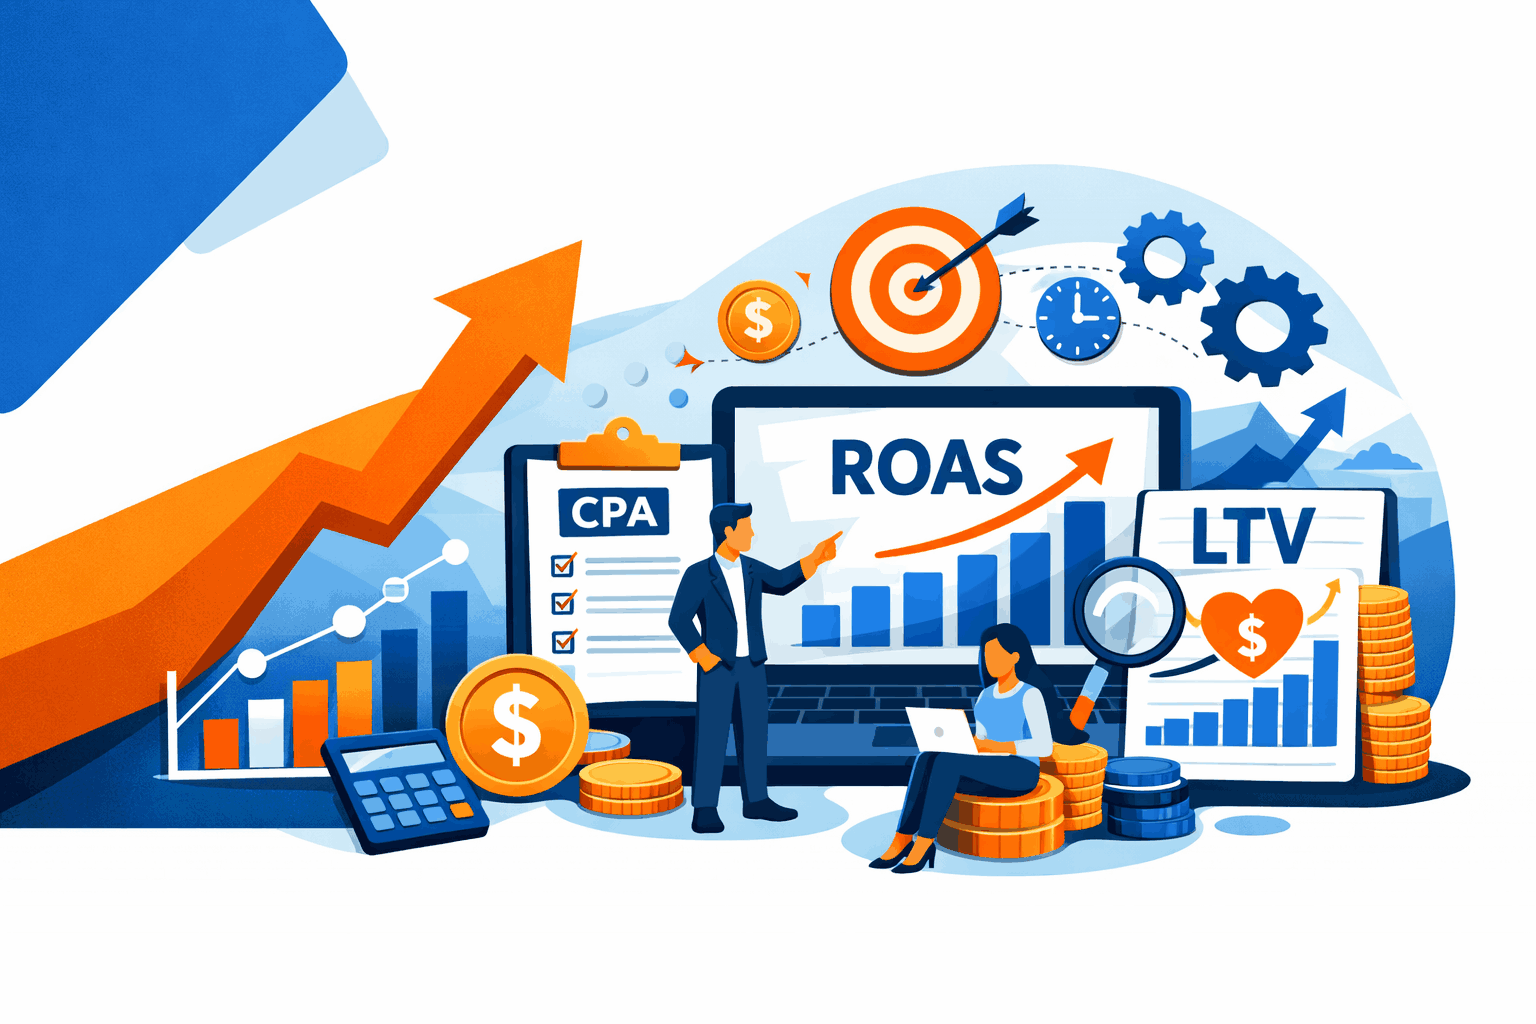
The real picture only appears when these three metrics are read together:
- ROAS → the power of the ad to produce revenue
- CPA / CAC → the cost of acquiring a customer
- LTV → the real value of the customer over time
These three are not really separate metrics.
They are different lines of the same financial statement.
At Brandaft, our approach to assessing ad performance begins at exactly this point. We do not read ad dashboards as a “report”; we treat them as the data source for a system that produces profitability and growth decisions instead.
Because the real question is this:
- Which campaign should be scaled?
- Which one should be optimised?
- Which one should be stopped?
In this article we will not simply cover basic definitions such as what ROAS is or how CPA is calculated — there is far more to it.
Instead we will build a model that lets you read ad performance against financial reality and use it to answer:
- How do you calculate a profitable ROAS?
- Why does the difference between CPA and CAC change the way you scale?
- How do you connect LTV to ad decisions?
- How do you find break-even ROAS and payback period?
- How do you interpret attribution and measurement gaps?
Our aim is not to teach you how to read ad reports.
It is to build a system that turns ad performance into profitable growth decisions.
Because in digital marketing, real success is not this:
“The ads are working.”
Real success is this:
“The ads are working, and the more we scale them the more profit they produce.”
Table of Contents
ToggleAre the ads “good”? Ask the right question first
One of the biggest mistakes in digital ad management is judging performance with the wrong question. Most teams open the ad dashboard and look for an answer to this: “Are sales coming in?” The real question is a different one: “Is this ad actually producing profit?”
Platforms like Meta, Google Ads or TikTok show you a great many metrics today. Number of sales, conversion value, ROAS, CPA… At first glance this data can look impressive. But most of the time these reports only show you revenue and nothing about profitability or return on investment (ROI) at all.
So to read ad performance correctly you first have to change the mental frame. The data in the ad dashboard is not a “success report”; it is really raw material for a decision system.
“There are sales” ≠ “there is profit”
A campaign producing sales does not mean it is working well. The gap between sales and profit is made of costs that digital marketing routinely overlooks.
Take an e-commerce campaign. ROAS may look high in the dashboard and the number of sales may be rising. But look at the finance side and the picture can change. The revenue from those sales can melt away against the costs below. Funnel problems — for example a high cart abandonment rate — can also pull down the real efficiency of the ad. That is why traffic and sales volume are not enough: reducing cart abandonment and similar conversion optimisations also deserve a look.
The main items that eat into the profitability of a sale are these:
- Cost of goods (COGS)
- Shipping and logistics costs
- Marketplace or payment system commissions
- Return and exchange costs
- Operations and customer service costs
- Campaign discounts and promotions
So when you assess digital ad performance, “did we get sales?” is not enough on its own. What actually has to be measured is whether the ad produces positive ROI in real terms.
This gets even more critical in social media advertising. Platforms like Meta or TikTok usually create demand, moving the user closer to the idea of buying. So short-term sales are possible, but whether those sales really turn into profitable customer acquisition is a separate piece of analysis.
Produce decisions, not metrics: stop / optimise / scale
The point of understanding ad performance is not to collect more metrics. The point is to produce a clear action from them.
At the end of every campaign there are really three decisions:
- Stop → the campaign is not profitable or shows no potential
- Optimise → there is potential, but there is friction somewhere in the funnel
- Scale → the campaign is both profitable and able to grow
Professional growth teams look at ad dashboards with this in mind. Metrics like CTR, CPC or ROAS are only diagnostic tools. The real job is to use them to answer this:
“Does this campaign have the potential to produce more profit for the company?”
The Brandaft approach to ad management differs at exactly this point. We assess campaigns not just through a performance metric, but through a financial decision model — that is the difference.
Because success in digital marketing is not metrics that look good in a report; it is getting these three decisions right:
- Which campaign should be grown
- Which campaign should be fixed
- Which campaign should be shut down immediately
To draw that line correctly you first have to understand the core metrics properly. In the next section we will take the cornerstones of ad performance — ROAS, CPA and LTV — and look at those concepts through their financial logic.
The core metrics behind ROAS vs CPA (but read with finance logic)
Almost every digital marketing team talks about the same metrics. ROAS, CPA, LTV, CTR, CPC… These have become the standard language of ad dashboards. But here is the problem: most of the time these Digital marketing metrics are learned only through their technical definitions, not their financial meaning.
So many businesses track the metrics but are still unable to say when to scale and when to stop with any confidence.
Read properly, though, these metrics do not only show performance; they also set the growth strategy of the company. Because ROAS represents revenue generation, CPA the cost of acquiring a customer, and LTV the long-term value of that customer.
In short, the true picture does not live in the ad report. When these three metrics are read together, a financial statement is where it emerges.
Let us look at the three most used digital marketing metrics in a short but correct frame.
What is ROAS?
ROAS (Return on Ad Spend) is the metric that shows the revenue produced against ad spend. In its most basic form it is calculated with this formula:
ROAS = Ad Revenue / Ad Spend
For example, when $300 of ad spend produces $1,200 in sales, a ROAS of 4 is the result.
ROAS is one of the most used performance indicators on digital ad platforms, because it answers this question quickly:
“How many times over is the ad bringing back the money I spend?”
But ROAS has an important limit. This metric measures revenue, not profit. Product cost, shipping, returns, commission and operating expenses are not part of the ROAS calculation. So a high ROAS does not always mean high profitability.
At this point ROAS should be treated not as a success metric on its own but only as a first performance signal and nothing more.
What is CPA? (Lead vs Purchase)
CPA (Cost per Acquisition), the average ad spend needed to produce one conversion, is calculated with a simple formula:
CPA = Ad Spend / Number of Conversions
But interpreting CPA correctly begins with being clear about which conversion you are measuring in the first place. In digital marketing CPA can mean quite different things.
For example:
- Lead CPA → the cost of a form fill or sign-up
- Purchase CPA → the cost of getting one sale
- Qualified Lead CPA → the cost of a lead with real sales potential
This distinction matters most in service businesses. A campaign may produce a low Form CPA but if most of those forms never turn into sales, the real acquisition cost will be far higher.
So CPA should usually be read alongside customer acquisition cost (CAC) — otherwise ad performance will look better than it is.
What is LTV? (a model, not a guess)
LTV (Lifetime Value) is the total economic value a customer will create over their relationship with the brand.
At its simplest, LTV can be calculated like this:
LTV = Average Order Value × Number of Repeat Purchases
In the real world, though, LTV is not just a simple multiplication. Customer behaviour changes over time and different segments produce different value. So an advanced LTV calculation usually includes these variables:
- Average order value
- Gross profit margin
- Repeat purchase rate
- Customer lifespan (retention)
- Cohort or channel-level behaviour differences
This is why LTV should not be read as a one-off forecast — a continuously updated business-model metric is how it should be treated.
To really understand ad performance these three digital marketing metrics have to be read together. Because ROAS shows you revenue, CPA shows you your acquisition cost, and LTV shows you the long-term value of the customer — that’s the signal.
In the next section we will focus on one of the most common errors in ad reporting:
why ROAS so often makes reality look better than it is.
The biggest lie in ROAS: measure profit, not revenue
ROAS is the best-loved metric in digital ad reports. It is simple, quickly understood and usually looks good. When a campaign produces a ROAS of 3, 4 or even 6, teams generally reach one conclusion: “The ads are working.”
But there is a critical problem here.
ROAS only measures revenue. Not profitability.
So many companies grow with campaigns that look strong in the ad reports while actually melting their margins. This becomes even clearer in e-commerce, marketplace selling and aggressive promotion periods.
At Brandaft this is why the first thing we look at when we assess ad performance is not ROAS. First we look for the answer to this:
What is actually left from this sale?
At this point ROAS has to be thought about in two different ways: gross ROAS and net ROAS.
“Gross ROAS” vs “Net ROAS”
The ROAS figure ad platforms show you is usually gross ROAS. It only shows the relationship between ad spend and the revenue earned.
But in the real financial statement of a business, revenue on its own means little, because the revenue from a sale is reduced by many cost items.
Take an e-commerce order. The real value a $1,000 sale leaves with the company is affected by these costs:
- Cost of goods (COGS)
- Shipping and logistics costs
- Marketplace or payment infrastructure commissions
- Return and exchange costs
- Operations and customer service costs
- Campaign discounts or promotions
So the ROAS figure you see in the ad dashboard usually does not reflect the real profitability of the business.
A healthier approach here is to use the idea of Net ROAS instead. Net ROAS takes into account the contribution margin left after a sale and helps you see whether the ad is genuinely profitable.
Put another way:
Gross ROAS shows you revenue.
Net ROAS shows you how close you are to profit.
Break-even ROAS from contribution margin
The most practical way to see whether an ad campaign is genuinely profitable is to calculate break-even ROAS for it.
Break-even ROAS shows you the point at which the ad runs without losing money — the minimum ROAS an ad has to reach.
At the base of this calculation sits contribution margin itself. Contribution margin is the share of sales revenue left after product cost and variable expenses are taken out.
Take a simple example:
- Product sale price: $1,000
- Product cost + operating expenses: $600
In that case the contribution margin is calculated like this:
Contribution margin = (Sale – Cost) / Sale
Which channel is actually paying off?
We measure the return of each channel separately and put your budget where it returns the most. A plan based on data, not luck.
LEARN MOREIn other words:
(1000 – 600) / 1000 = %40
This business has a contribution margin of 40%. Now we can calculate its break-even ROAS.
The break-even ROAS formula
Calculating break-even ROAS is quite simple:
Break-even ROAS = 1 / Contribution Margin
For a business with a 40% contribution margin, the calculation looks like this:
Break-even ROAS = 1 / 0.40 = 2.5
Which means:
The ad campaign has to produce a ROAS of at least 2.5 for the business not to lose money.
A small table makes the picture clearer here:
| contribution margin | Break-even ROAS | What it means |
|---|---|---|
| %20 | 5 | The ad needs a ROAS of at least 5 not to lose money |
| %30 | 3.33 | Campaigns below 3.33 ROAS lose money |
| %40 | 2.5 | 2.5 ROAS is the break-even point |
| %50 | 2 | Below 2 ROAS the advertising is unprofitable |
So “what is a good ROAS?” has no single answer. The right question is this:
What is the break-even ROAS for your business model?
Interpreting ad performance without doing that calculation is usually misleading.
How to read ROAS in discount and promotion periods
The periods when ROAS is most often misread are usually discount campaigns.
During Black Friday, end-of-season sales or aggressive promotion periods, sales volume rises and ROAS usually looks strong. But two important variables come into play:
- Average order value can fall
- Contribution margin can shrink
For example, a product that normally carries a 40% contribution margin can see that margin fall a long way when it is sold with a 20% discount. Break-even ROAS then rises as well.
Put another way, in promotion periods the same ROAS figure no longer represents the same profitability.
So when you interpret ROAS in discount periods you need to look at three questions together:
- After the promotion, what is the contribution margin left?
- How did average order value (AOV) change?
- Did return rates rise during the promotion?
Read together, these variables give a far more realistic view of ad performance.
In the next section we move to the second big thing that misdirects ad performance:
why CPA so often misleads scaling decisions.
Read CPA wrong and scaling will sink you
Many growth decisions in digital ad management are made on CPA. Campaigns are usually judged against this question: “Is acquisition cost below our target?” If the answer is yes the campaign is scaled; if not it is stopped.
But there is a critical risk here.
CPA is one of the most misread digital marketing metrics. If it is not clear what CPA is measuring, the metric can mislead growth decisions.
A campaign may be producing a low CPA. Everything looks fine in the dashboard. But if those acquisitions are not real customers, or never turn into sales, a low CPA just means low-quality traffic in practice.
So CPA should be read not as a performance metric on its own but as part of your customer acquisition economics as a whole.
CPA or CAC? (defining acquisition cost)
CPA (Cost per Acquisition) is the average ad spend made to get one conversion. That conversion is sometimes a sale, sometimes a sign-up, sometimes a form fill.
The basic formula is simple:
CPA = Ad Spend / Number of Conversions
But there is an important distinction here: CPA and CAC are not the same thing.
- CPA → the conversion cost measured by the platform
- CAC (Customer Acquisition Cost) → the real cost of acquiring a customer
A CAC calculation counts not only ad cost but every expense made to win a customer.
For example, a CAC calculation might include these items:
- Ad spend
- Sales team costs
- CRM and marketing tools
- Content and creative production
- Agency or operational expenses
So CPA usually shows you the surface of marketing performance, while CAC shows you the real cost of the business model — that’s the signal.
A campaign may be producing a CPA of $6. But once the sales process, operations and marketing costs are included, real CAC can climb to $10. That difference alone can change a scaling decision completely.
The right CPA for lead gen: “qualified lead”, not “form”
In a service business or a lead generation setup, CPA gets even harder to read, because here the conversion is usually not a sale but a form fill or an appointment request.
Many companies make one mistake at that point: they accept Form CPA as the success metric.
To see real performance, though, you have to draw this line:
- Form CPA → every lead is treated as equally valuable
- Qualified Lead CPA → the cost of a lead with sales potential
Say an education provider collects 100 forms from an ad. Cost per form is $2 and everything looks successful in the dashboard.
But when the sales team calls those forms, the real picture can appear:
- only 40 of the 100 forms are genuinely relevant
- 15 progress to a sales conversation
- 5 turn into real customers
In that case the real acquisition cost changes like this:
- Form CPA → $2
- Qualified Lead CPA → $5
- Sales CPA → $40
So in a lead-generation model the right metric is usually cost per qualified lead or customer acquisition cost — that’s the question to ask.
Mistakes in comparing CPA across channels
Another common mistake when reading CPA is comparing different channels head to head.
Many teams make this comparison, for example:
- Google Ads CPA → $9
- Meta CPA → $5
At first glance Meta looks more efficient. But the comparison is usually incomplete, because the channels work at different funnel stages altogether.
Broadly, digital channels play different roles:
- Google Ads → captures high-intent search traffic
- Meta / TikTok → creates demand and reaches the user at the discovery stage
- Retargeting campaigns → converts users who are already interested
So comparing CPA figures from different channels directly can produce the wrong conclusions.
Retargeting campaigns, for example, usually produce the lowest CPA. But that is not because the campaign is brilliant; it is because the users were already close to buying.
To read channel performance more accurately, assess these questions together:
- This channel — which stage of the funnel is it working at?
- The user — did they arrive already intending to buy?
- The campaign — is it creating new demand or capturing demand that already exists?
Seen this way, CPA is not only a cost metric; it also becomes a signal that tells you which stage of the customer journey you are at over time.
In the next section we will talk about the metric that really changes ad performance:
LTV. Because most growth strategies are scaled not on CPA but on LTV.
The real game: tying the ad decision to LTV
Most teams in digital ad management make the same mistake: they judge performance only on the first sale and stop there. The campaign is read through its first-purchase cost and decisions are made on that data.
But the real growth model starts here.
If a customer keeps a relationship with the brand after that first purchase, ad performance looks completely different. Because the value an ad produces does not come from the first sale; it comes from the total revenue that customer will generate across their lifetime above all.
This is why the metric that really matters for growth teams is LTV (Lifetime Value).
LTV lets you read ad performance on a long horizon. CPA shows you the cost of winning a customer, and LTV shows you the real economic value of that customer — that’s the signal.
Read together, these two metrics answer one question:
Does the money we spend to win a customer really come back over the long run?
How is LTV calculated? (3 levels)
LTV can be calculated at different levels depending on the data infrastructure and business model of the company. Approaches range from a simple estimate to detailed cohort-based models.
A three-level approach is usually used.
1. Simple LTV model
The most basic LTV calculation multiplies average order value by the average number of repeat purchases per customer.
LTV = Average Order Value × Number of Repeat Purchases
For example:
- Average order value: $35
- Average repeat purchases: 3
In this case an LTV of roughly $105 is the result.
This model gives a quick reference but does not fully reflect costs or customer behaviour.
2. Mid-level LTV model
At the next level the calculation brings in gross profit and retention rate as well.
This gives a more realistic picture for e-commerce and subscription models in particular, because it accounts not only for revenue but for profitability too.
For example:
- Average order value: $30
- Gross profit margin: 40%
- Average customer lifespan: 3 purchases
The real economic value created per customer can then be calculated like this:
LTV = (Average Order × Gross Profit Margin) × Repeat Purchases
This model brings ad decisions much closer to financial reality.
3. Advanced LTV model (cohort-based)
Advanced growth teams do not calculate LTV from averages alone. Instead, cohort-based analysis is the usual approach.
In this approach customers are segmented by these criteria:
- Acquisition channel (Google Ads, Meta, organic and so on)
- Campaign type
- Product category
- Geography or customer segment
That makes it possible to answer an important question:
“Which channel actually brings in more valuable customers?”
Users coming from Meta ads, for example, may have a low first-purchase value, but if their repeat purchase rate is high the real LTV can be higher. In that case a ROAS that looks low in the short term can be a stronger growth engine over the long run.
What should the LTV:CAC ratio be?
LTV read on its own does not mean much. The important thing is how this value stands against customer acquisition cost (CAC) — that relationship is what counts.
It is usually expressed as the LTV:CAC ratio and read from there.
The basic logic is this:
The value you get from a customer must be meaningfully above the cost of winning them.
The generally accepted reference ranges are these:
| LTV:CAC ratio | Interpretation |
|---|---|
| 1:1 | The business model is unsustainable; customer acquisition is losing money |
| 2:1 | Fragile growth, limited margins |
| 3:1 | A healthy growth model |
| 4:1 and above | Strong growth potential |
But there is no single “right ratio” here, because different sectors have different growth dynamics.
SaaS companies, for example, can accept a higher CAC at the start because the customer stays for a long time. E-commerce brands usually expect a faster return.
So the soundest approach is not to look for a single number but to set a target band.
Payback period: “how many days until the ad pays for itself?”
LTV shows long-term value, but the cash flow of a company is usually decided over the short term. That is where you need to look at payback period again.
Payback period shows you how long it takes a customer won through ad spend to pay back their acquisition cost — that’s the signal.
Put another way, it answers this question:
“How many days until the money we spend on ads comes back?”
For example:
- CAC: $24
- Gross profit from the first order: $12
In that case at least two purchases are needed to pay back the ad cost.
If the customer makes that second purchase within 30 days, payback period comes to about 30 days on that basis. If the second purchase only happens 120 days later, the model becomes far riskier for cash flow.
Payback period is a critical metric in these business models in particular:
- SaaS and subscription models
- Education or consultancy services
- B2B sales that require a high CAC
So growth teams usually ask these two questions together:
- Is the LTV:CAC ratio healthy?
- Is the payback period acceptable?
Assessed together, these two metrics stop ad performance being just a marketing metric and turn it into a financial indicator of how sustainable the business model is.
How do the three metrics combine in one table? (the Brandaft model)
ROAS, CPA and LTV are useful metrics when you look at them one by one. But the real decision does not live in any single one of them: a single system in which these metrics are read together is where it emerges.
Many businesses analyse ad performance in pieces. The marketing team looks at ROAS, the sales team at lead counts, the finance team at profitability. That fragmented approach usually leads to one outcome: the reports look good but growth is not sustainable.
At Brandaft the approach we use to assess ad performance therefore does not focus on a single metric. Instead we bring all the digital marketing metrics together in a three-layer decision model.
The aim of this model is not only to measure performance but to settle three decisions:
- The campaign — should it be stopped?
- The campaign — should it be optimised?
- The campaign — should it be scaled?
To see this decision system more clearly we can use the Performance Pyramid approach.
Performance Pyramid
Ad performance is really made of three different layers of analysis. The top layer represents the financial outcome, the middle layer marketing performance, and the bottom layer technical diagnosis.
| Layer | Metrics | What Does It Tell You? |
|---|---|---|
| Top layer | Profit / Payback / LTV:CAC | Shows whether the business model is genuinely sustainable |
| Middle layer | ROAS / CPA | Shows how ad performance contributes to the financial result |
| Bottom layer | CTR / CPC / CVR | Helps diagnose technical problems inside the campaign |
This pyramid shows an important principle:
The top layer produces decisions; the bottom layer produces diagnoses.
The ROAS of a campaign may have fallen, for example. On its own that produces no decision. This is where the lower-layer metrics come in:
- CTR may have fallen → a creative or message problem
- CPC may have risen → a competition or targeting problem
- CVR may have fallen → a landing page or offer problem
These diagnoses help you understand why a campaign has lost performance. But the metrics that decide whether it should actually be stopped are the financial indicators in the top layer.
Put another way:
A CTR problem does not make the advertising bad.
But a negative LTV:CAC ratio makes the business model unsustainable.
A 5-condition checklist for the “scaling decision”
In ad performance analysis the most critical decision is usually made at the scaling stage. When a campaign performs well, budget is raised, new audiences are tested, or it is widened with different creatives.
But the biggest mistake at this point is making the scaling decision on ROAS alone.
In the Brandaft approach, scaling a campaign usually requires these 5 basic conditions to be met:
- Net ROAS must be above the break-even level
- Payback period must be below the target range
- Conversion rate (CVR) must be stable
- Frequency and creative fatigue must be under control
- Operations and stock must be able to take the scaling
Simple as it looks, this checklist is the foundation of a growth strategy. Many companies make the scaling decision on ad performance alone while the operations side cannot support that growth.
A campaign may be working very well, for example. ROAS is high, CPA is within target. But if stock capacity is limited or customer service cannot meet demand, aggressive scaling can damage the brand experience.
So real growth happens not through ad performance alone but through the whole system working together as one.
In the next section we move to something most businesses overlook when they assess ad performance:
Attribution and measurement reality. Because the performance data you see in ad dashboards may not always reflect the real picture.
Attribution and measurement reality (2026)
Digital ad reports often look like hard facts. You look at the platform dashboard and see clearly how many sales a campaign brought, how much revenue it produced and what the ROAS was. But in modern digital marketing this data is usually the output of a model, not a hard certainty.
Since 2020 in particular, data privacy regulation, iOS tracking limits and user consent mechanisms have changed the measurement world seriously. Because platforms like Meta, Google or TikTok can no longer track the full user journey, they calculate performance with prediction models instead.
So one of the most critical questions when you interpret ad reports is this:
“Did this sale really come from this ad, or is that just how the system modelled it?”
At this point, reading ad performance correctly requires understanding four important measurement realities.
• Why does platform ROAS inflate?
The ROAS reported by ad platforms usually looks higher than the real performance of the business. The main reason is the way the attribution model works. Platforms tend to attach the user to their own ads wherever they can.
A user may see an ad on Instagram, for example, but make the purchase days later through a Google search. The platform can then use view-through or different attribution models to claim part of that sale for itself. To avoid getting lost in this data mess and to work out which channel is really “feeding” the budget, professional Instagram sales techniques and sound measurement strategies come into play.
In digital marketing the credit for the final touch (last-click) usually goes to Google, but the visual spark that triggered the buying intent was often struck on Instagram.
Attribution windows also differ between platforms. Some systems work from a 1-day click while others use a 7-day or longer window. That model difference can make ROAS look different across platforms. It is the same on newer channels: ChatGPT Ads let you choose a 7, 14 or 30-day click window; you need to align the windows with your other channels before you compare.
So platform ROAS is often valuable as a performance signal, but on its own it does not represent real profitability.
• How to read the GA4 vs Ads Manager gap
Many marketing teams live this: Meta Ads Manager shows sales high, but GA4 reports a lower conversion count. It is usually confusing, and it is actually quite normal.
The reason is that the two systems use different attribution logic.
Ads Manager generally assesses in-platform interactions with a broader attribution model, while GA4 usually takes a more conservative approach and attributes the user to the last touchpoint.
So a certain gap between GA4 and platform data is to be expected. The important point here is not which system is right but how the data is interpreted.
Among professional growth teams, platform data for campaign optimisation, and GA4 or data-warehouse systems for understanding real performance is the usual approach.
• iOS and measurement reality after consent
After the data privacy regulations, ad measurement changed significantly. A meaningful share of users now refuses tracking, and that causes data loss in mobile apps and social media platforms in particular.
So three basic disciplines stand out in modern ad measurement.
Consistent use of UTM parameters lets you track different traffic sources correctly and makes channel analysis easier.
Server-side measurement infrastructure helps recapture some of the data platforms lose and improves data accuracy.
An offline conversion matching system links CRM or sales data to ad platforms and makes it possible to measure real customer acquisition more accurately.
Used together, these three approaches make the measurement infrastructure far more reliable.
• Incrementality: is the ad really bringing extra sales?
One of the least discussed but most critical topics in digital ad performance is incrementality. That is, working out whether the ad really creates a new sale.
In some cases ads capture users who already intended to buy. The ad is then not the cause of the sale, only part of the process. This is very common in retargeting campaigns.
An incrementality test is used to answer that question. The basic logic is quite simple: ad delivery is stopped for a particular group of users and their buying behaviour is compared with a control group.
If sales fall sharply when the ads are switched off, the advertising really is creating extra demand. But if buying behaviour stays largely the same, the campaign may only be capturing demand that already exists.
This approach lets you judge ad performance not only on metrics but on real business impact.
Understanding these realities matters, because in modern digital marketing performance cannot be explained by the numbers in ad dashboards alone. Healthy growth means understanding how the data is produced and how it should be read.
Channel-level measurement (Google Ads / Meta / TikTok and others)
One of the most common mistakes in assessing digital ad performance is judging every channel with the same metric and the same expectation. Different ad platforms work at different stages of the customer journey altogether.
So when ROAS, CPA or other digital marketing metrics are read channel by channel, the intent level of the user must always be taken into account. Search engine ads usually capture existing demand, while social media platforms usually create it. That difference can make performance metrics look different in the short term.
• Google Ads: high intent → ROAS recovers faster
Google Ads usually captures users with high purchase intent. Because the user is already looking for a product, service or solution, the chance of conversion is relatively higher. So ROAS often recovers faster in Google Ads campaigns.
But the main factor driving performance on this channel is usually not the creative: it is the offer structure and the landing page quality. When keyword targeting, bid strategy and page experience all work, conversion rate can improve quickly.
• Meta: creates demand → ROAS can look low in the short term
Meta and similar social media platforms usually let a user discover a product or service they were not actively searching for. So these channels generally take on a demand creation role.
This can make ROAS look lower in the short term. But if Meta campaigns are winning new customers, performance not on the first purchase alone but on an LTV horizon should be evaluated.
Put another way, the real value of Meta campaigns usually comes not from the first sale but from the value that customer creates across the whole relationship above all.
• The retargeting trap: the truth about “easy ROAS”
Retargeting campaigns usually produce the highest ROAS figures. That is not because the campaign is brilliant but because the users were already close to buying.
Users who have visited the site before or interacted with the product are generally closer to conversion. So retargeting campaigns naturally show high performance.
But judging an ad strategy on retargeting performance alone can mislead you, because these campaigns usually convert existing demand, they do not create new demand.
When you analyse performance for a healthy growth model, this distinction has to be kept:
- Demand capture channels (Search)
- Demand creation channels (Social)
- Demand conversion channels (Retargeting)
This perspective lets you read channel performance more realistically and scale ad investment correctly.
Putting it into practice: a 1-page report template (copy-paste)
Analysing ad performance is usually made more complicated than it needs to be. Among different dashboards, long reports and dozens of metrics it gets harder to answer the real question: Is the advertising really working, and should it be scaled?
In the Brandaft approach, performance tracking is designed to stay simple but decision-producing wherever possible. The aim is not to track hundreds of metrics; it is to read the right ones at the right frequency and decide quickly.
So for many growth teams the most practical answer is a one-page performance report. Two perspectives — weekly and monthly — let you watch campaign health and business-model sustainability together.
• Weekly management panel (core metrics)
The aim of the weekly report is not to change strategy but to check the health of the campaigns. This panel usually holds the core digital marketing metrics needed for campaign optimisation.
| Metric | What does it show? |
|---|---|
| Budget spent | The scale level of the campaign |
| ROAS | The revenue-producing performance of the ad |
| CPA | Acquisition cost |
| CTR | Creative and message performance |
| CPC | Traffic cost and competition level |
| CVR | Landing page and offer performance |
The aim of this panel is to answer one question:
Is there a technical problem in the campaign?
• Monthly management panel (profitability + cohort)
The aim of the monthly report is to analyse not only the performance of the campaign but its contribution to the business model as well. So financial metrics come into play in the monthly analysis.
| Metric | What does it show? |
|---|---|
| Net ROAS | How close you are to real profitability |
| CAC | Real customer acquisition cost |
| LTV | The long-term value of the customer |
| LTV:CAC ratio | How sustainable the growth model is |
| Payback period | How long the ad investment takes to return |
| Cohort analysis | Customer value differences by channel |
The aim of this panel is to answer this question:
Is the advertising only bringing sales, or is it producing profitable growth?
• Campaign shutdown / scaling rules
The most important output of an ad report is action. Once the performance of a campaign has been analysed, teams need a clear decision: stop, optimise or scale.
That decision is usually made on the following basic rules:
- Net ROAS must be above the break-even level
- Payback period must be below the target range
- Conversion rate (CVR) must be stable or rising
- Frequency and creative fatigue must be under control
- Operations and stock capacity must be able to take the scaling
Thanks to these rules, ad performance stops being just a report and becomes a management system in its own right. Because the aim of a good ad strategy is not to see more metrics but to make the right decision at the right time.
12 common mistakes in measuring ad performance (the Brandaft diagnosis list)
Misreading ad performance is usually not a technical problem but an interpretation error. The campaigns may actually be working, but when the metrics are analysed wrongly the decisions go wrong. That usually leads to closing campaigns early, scaling the wrong things or wasting budget.
At Brandaft the mistakes we meet most often in ad analysis usually fall under these headings:
• Looking only at ROAS
ROAS shows revenue but not profitability. Interpreted without a contribution margin and a break-even calculation, ROAS is usually misleading.
• Mistaking a lead for a sale
Filling in a form is not winning a customer. Without separating qualified leads and real customer acquisition cost, CPA looks better than it is.
• Calling the last click “the truth”
The last-click attribution model simplifies the user journey. But most purchases are the result of more than one touchpoint.
• Assuming LTV is fixed
Customer value changes over time. LTV can differ sharply by channel, product or customer segment.
• Blaming the creative and never fixing measurement
A drop in performance usually comes not from the creative but from measurement errors or attribution differences.
• Judging every channel with the same metric
Search, social and retargeting channels work at different funnel stages. The same ROAS or CPA expectation produces the wrong conclusions.
• Mistaking retargeting performance for growth
Retargeting usually converts existing demand. When it creates no new customer acquisition, scaling stays limited.
• Making long-term decisions on short-term metrics
Judging by first-purchase data ignores the LTV effect.
• Never questioning the attribution model
Performance data in platform dashboards may not always reflect the real sales impact.
• Deciding on a single week of data
Ad algorithms go through learning phases. Early decisions can mean missing the potential of a campaign.
• Ignoring operational capacity
When successful campaigns scale quickly, stock, logistics or customer experience problems can appear.
• Scaling before the measurement setup is built
Performance analysis done without UTM discipline, server-side measurement or CRM integration stays incomplete.
Most of these mistakes are not about ad management but about a lack of measurement discipline more than anything. When the right metrics are not read in the right context, even campaigns that work well can be stopped by the wrong decision.
Conclusion: “not a channel, a system”
Digital ad performance is usually debated channel by channel. Is Meta better, is Google Ads more profitable, does TikTok scale… Yet real growth usually comes not from a single channel but from a properly built system instead. Because ad performance is not produced by campaign optimisation alone; measurement infrastructure, the financial model and the creative/landing experience working together is where it emerges.
So for sustainable growth the real focus is not picking a platform but building a structure that makes ad performance produce decisions. When ROAS, CPA and LTV are wired together correctly, ad reports stop being just a performance dashboard and, for the company, a genuine growth control centre is what they turn into.
If your ad reports only show you sales counts but give you no clear answer about profitable scaling, the problem is usually not in the campaigns but in the system. At Brandaft the first step we take is therefore always the same: we diagnose not the ad accounts but the measurement and profitability model. If you cannot clearly see your own break-even ROAS, LTV:CAC ratio or payback period, then in our free diagnosis-focused audit call we can map that picture out together.