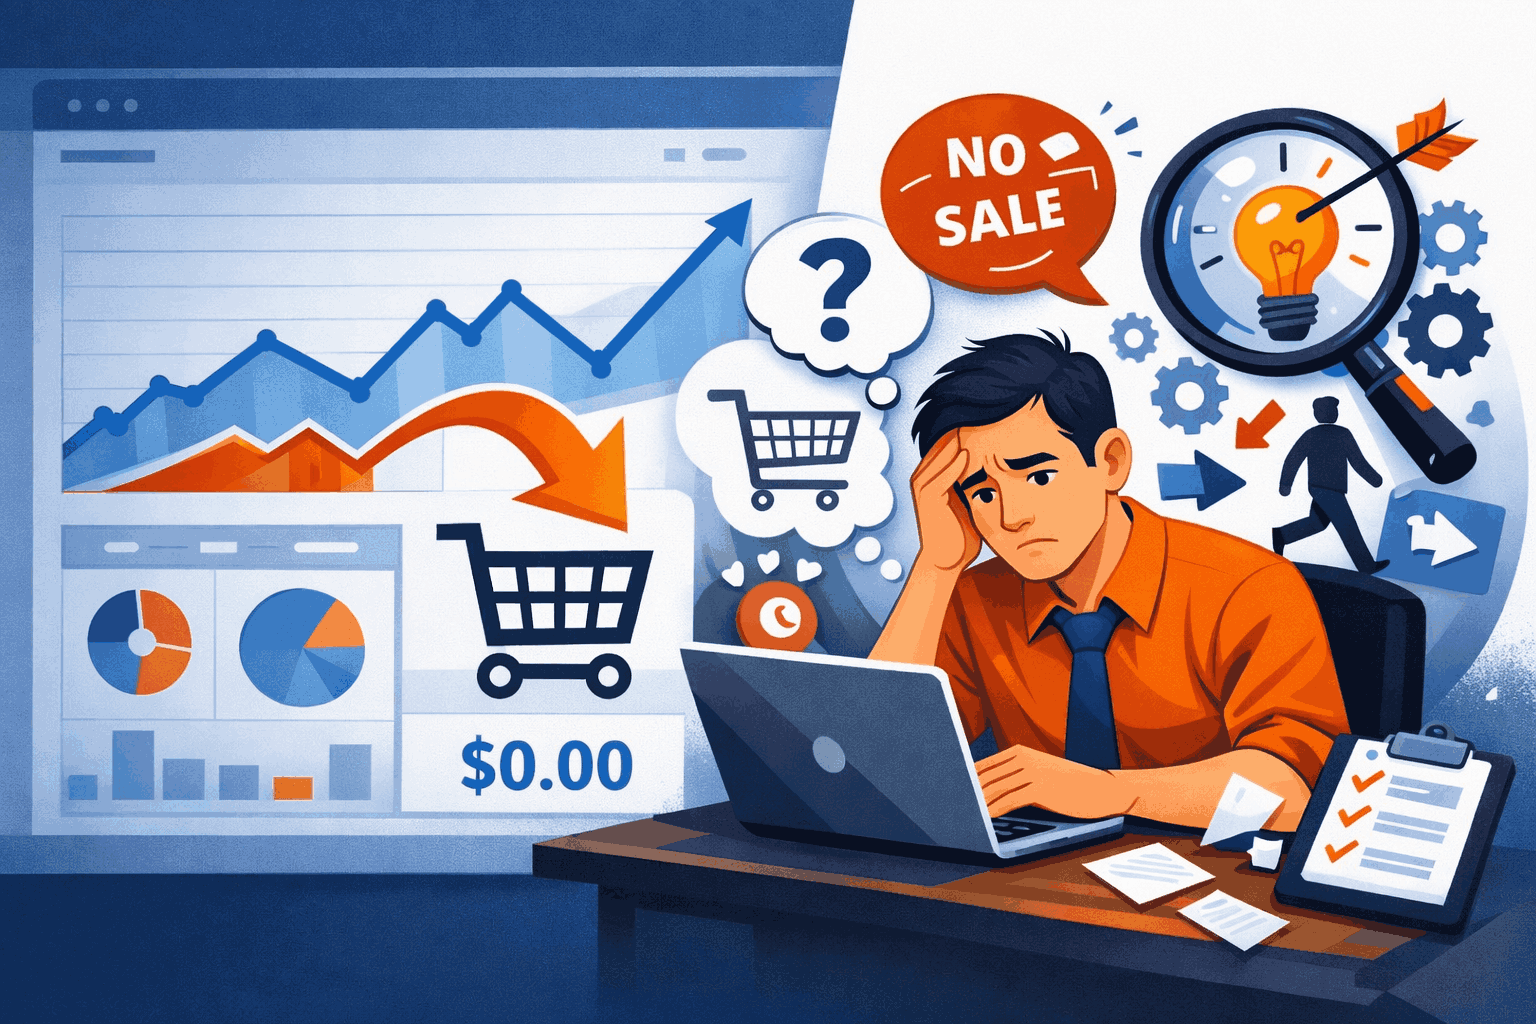
The numbers look good, but the till is silent.
In Google Search Console, impressions are rising, traffic is flowing in Analytics… but at the end of the day, the one number we call “sales” doesn’t budge. At this point, most teams have the same reflex: more traffic. But the problem usually isn’t the traffic; it’s what happens after the trafficarrives.
At Brandaft, we always start with this sentence: Traffic is a metric; sales are a result.
Between the two, there’s something rarely discussed but that decides everything: the conversion system. The user’s intent and the page’s message, trust signals and how the offer is perceived, measurement and the way decisions are made… If one link in this system is broken, even the right traffic won’t produce sales.
You won’t find “generic CRO tips” or boilerplate tactics in this article.
Instead, we’ll share a clear, 30-minute diagnostic flow. Step by step, we’ll find where traffic loses its meaning, where users hesitate and exactly where sales are lost. Because ranking at the top of search engines doesn’t mean sales on its own; the real difference comes from what the system does after that ranking. Our goal isn’t to persuade you; it’s to give you back control. Because a sales problem is rarely a mystery — it just hasn’t been looked at from the right place.
Table of Contents
ToggleFirst, a Definition: What Does “No Sales” Really Mean?
The phrase “no sales” is usually used as if it describes a single problem.
But what we see in the field is this: the same phrase can describe three completely different situations at once. And each of these three scenarios has a different diagnosis and a different fix.
Which “no sales” scenario are you in?
| Scenario | What you see | First suspect | First action |
|---|---|---|---|
| Traffic, but no sales at all | Sessions, but no conversions | Broken tracking / wrong intent / broken trust | GA4 events + GSC/GA4 consistency check |
| Sales, but below expectations | Traffic rising, CVR falling | Message–intent mismatch / friction | Funnel: add_to_cart → begin_checkout breakdown |
| Sales, but no profitability | Revenue, but no margin | Weak offer/framing / discount dependency | Read revenue per session + AOV + return rate |
- Traffic, but no sales at all: This is usually the scenario that causes the most panic. People are landing on the page, but not a single order, form or payment comes through. In this case, the problem usually isn’t that “the product is bad”. Either tracking is broken, or the traffic has the wrong intent, or the user gets a “I shouldn’t trust this place” signal at the very first touchpoint.
- Sales, but far below expectations: The system isn’t completely broken, but there’s a serious leak. As traffic rises, sales don’t rise at the same pace, the conversion rate drops or users disappear after the cart. This pattern is usually caused by a message–intent mismatch, weak trust signals or unnecessary friction (long forms, complicated checkout steps).
- Sales, but no profitability: This is the most dangerous scenario, because at first glance everything looks “fine”. Sales come in, but ad costs are high, a discount dependency has formed or a low average order value is wiping out all the effort. The issue here is less about conversion and more about the offer and the perception of value being set up wrong. CRO isn’t about cutting prices; it’s about framing value correctly.
Any analysis done without separating these three situations makes the problem bigger.
That’s why, before starting the diagnosis, we need to be clear about what we’re measuring first.
In this article, we’ll look at 5 key digital marketing metrics(explained simply)
We won’t be putting on a “dashboard show” here.
We’ll focus only on the 5 core metrics that truly explain a sales problem:
- Conversion Rate: Out of every 100 visitors, how many actually take action? It shows us the overall picture, but it’s never enough on its own.
- Add-to-Cart Rate: Does the product attract interest? Is the user saying “I don’t want it”, or “let me take a look” and then giving up?
- Checkout Start Rate: How many of the people who add to cart move on to checkout? Drops here usually send a trust and surprise-cost signal.
- Cart Abandonment Rate (share of abandoned carts) : Why did the user give up at the most critical point? Shipping, returns, mandatory account creation or a complicated checkout flow reveal themselves here.
- Revenue per Session: Shows the part of the traffic that actually “makes money”. It’s one of the metrics that most clearly explains profitability problems and a weak offer.
5 Metrics for the Diagnosis: What They Tell You and When They Raise an Alarm
| Metric | What it tells you | Red flag | First check |
|---|---|---|---|
| Conversion Rate | The overall result of the system | CVR falling while traffic rises | Channel/device breakdown |
| Add-to-Cart Rate | First persuasion of the product/offer | High traffic + low add-to-cart | Above-the-fold message on the product page |
| Checkout Start Rate | Trust + surprise cost signal | Adds to cart, but no checkout start | Visibility of shipping/returns/fees |
| Cart Abandonment Rate | Drop-off at the moment of decision | Long time in checkout, then exit | Guest checkout / form fields |
| Revenue per Session | The money-making quality of the traffic | Traffic rising, RPS flat/low | RPS comparison by channel |
It’s when we read these metrics not separately, but together that the reason sales aren’t coming in becomes clear.
In the next step, we’ll see at which layer this data breaks down: measurement, intent, trust, friction or the offer?
The Conversion Bottleneck Map: The Problem Shows Up in 4 Layers
Conversion bottleneck: a quick read by layer
| Layer | Typical symptom | Evidence (what to look at) | First move |
|---|---|---|---|
| 0 — Measurement | “There’s traffic” but no behavior | GA4 events / GSC vs GA4 consistency | |
| 1 — Intent | Reads but doesn’t buy | Weight of TOFU queries + low add_to_cart | Separate landing / message alignment for BOFU |
| 2 — Trust | Adds to cart, no payment | Checkout behavior / hesitation signals | Move trust blocks before the CTA |
| 3 — Friction | Starts but doesn’t finish | Struggling with form fields / mobile gap | Guest checkout + simpler forms |
| 4 — Offer/Value | Gives up at the last moment | Hesitation around price / comparison behavior | Packaging + guarantee + “why us” |
The “no sales” problem doesn’t appear at a single point.
Usually, small breaks that pile up at different points in the user journey turn into one big result at the end: no payment. That’s why at Brandaft we don’t treat conversion through a single metric or a single page; we treat it as a layered system instead.
This approach is what we at Brandaft call the Conversion Bottleneck Map in our work.
The goal is to answer the question “where exactly does the problem start?” before asking “what should we do?” Because if you intervene at the wrong layer, you can kill even the right traffic. You optimize the content, but if measurement is broken, you get no results. You try to add trust, but the traffic has the wrong intent.
This map examines the problem across 4 main layers (actually starting from layer zero).
Each layer answers a different question:
- Are we really measuring, or are we fooling ourselves?
- Are the right people coming?
- Do the people who come believe us?
- Can the people who believe and want it actually do it?
- And finally: they wanted it, but was it worth it?
In the next step, we’ll break down each of these layers one by one, in bullet points and focused on diagnosis for you.
Our goal isn’t to give “advice that fits everyone”; it’s to pinpoint the layer where your problem is stuck so you know where to act.
Layer 0: The Data Layer (Tracking Errors / Fooling Yourself)
This is the most frequently skipped layer, but the most critical one.
Because with the wrong measurement you make the wrong diagnosis; and with the wrong diagnosis, you can kill even the right traffic. You change the content, increase the budget, redesign the site… but the problem was in the data itself from the very start.
In many scenarios where you say “there are no sales”, the system is actually telling you: I’m not measuring correctly.
The most common tracking problems we run into in this layer are:
- GA4 event setup is wrong or incomplete
Purchase, add_to_cart, begin_checkout or view_item events are broken or don’t fire at all. In that case, the funnel doesn’t look healthy; you can’t really know where you’re dropping off. - Bot / spam traffic pollutes the data
It shows up especially in “impressions but no engagement” scenarios. Fake queries on the SEO side, and low-quality placements or automated clicks on the ad side, inflate the session count but don’t produce behavior. The result: high traffic, near-zero meaning. - Inconsistent attribution and channel breakdown
Google Search Console sees the traffic as “organic”, while in GA4 the landing pages are scattered meaninglessly. On the ad side, Meta/Google Ads says “there are conversions”, but GA4 can’t see them. When the relationship between channel, page and session breaks down, you can’t tell which traffic is actually working.
Action note (a clear rule):
Do your sales stop when your ads stop?
Let’s bring your category and product pages to the top of organic search and reduce your sales’ dependence on ad spend.
E-COMMERCE SEO QUOTEIf you see thousands of impressions in GSC and near-zero engagement in GA4, the first diagnosis isn’t the content; it’s the setup.
Quick mini-diagnosis rules for this layer:
- SEO scenario: If clicks are coming in from GSC but in GA4 Average Engagement Time is extremely low → either there’s an intent–page mismatch or tracking isn’t working correctly.
- Ad scenario: If clicks and spend rise in the ads dashboard but no sessions or events appear in GA4 → check the tracking, UTMs, event mapping or consent configuration.
- General red flag: If impressions/clicks are soaring in GSC or ad dashboards but there are almost no sessions in GA4 → tags, filters, domain settings or bot traffic are the likely culprits.
Any CRO (conversion rate optimization) work done without clarifying this layer is like driving in the dark and hoping for the best.
That’s why conversion diagnosis always starts here: What are we really measuring?
Layer 1: Intent (Did the Right People Come?)
If measurement is correct and the traffic is really coming, the next question is:
Does this traffic intend to buy, or is it just looking for information? “Feeling” this distinction isn’t enough; you have to prove it. Because choosing profitable keywords in Google Ads is usually done with data, not intuition. When the search terms report, conversion rate (CVR), cost per acquisition (CPA) and commercial intent signals are reviewed together, it becomes clear which queries actually bring in sales.
Because traffic with the wrong intent is usually silent. It comes, looks, reads… but doesn’t buy. And if you don’t look at it with the right metrics, you’ll interpret this as “the product is bad”.
- Intent differs by source (provable): In organic traffic, queries dominated by “what is / how to / example / comparison” usually show up in GA4 with:
- Longer Average Engagement Time
- Lower Add-to-Cart Rate
at the same time.
This shows not that users aren’t interested in the page, but that they’re looking for something else — that’s the signal.
- Validating intent with behavioral data (project example): In one project, a landing page built as a product page was getting ~10,000 organic sessions a month.
The GA4 data showed:
- Average engagement time: high
- Add-to-cart rate: below 0.3%
So users weren’t leaving the page; they just weren’t buying. Microsoft Clarity recordings made the picture clear when we reviewed them:
- More than 70% of users stayed in the top half of the page
- Scroll depth was dropping
- Very few users reached the price and CTA areas
This data told us: users weren’t rejecting the product, they just weren’t getting to it yet.
- Intent break in ad traffic (a measurable signal)
In the same project, CTR on the ad side was high; but in GA4:
- Checkout Start Rate was almost zero
- Session duration was noticeably lower than for organic traffic
What we found after reviewing it was simple: the ad creative promised an “instant solution”, while the landing page was “explaining information”. It wasn’t a traffic problem, but a promise–page mismatch.
Mini checklist (evidence-based):
- High session duration + low add-to-cart → Informational intent
- High clicks + low checkout start → Message mismatch
- If scroll depth drops before the price/CTA → No purchase intent
- If organic and ad traffic behave differently on the same page → Intent is mixed
The goal in this layer isn’t to push the user; it’s to accept the user’s mental stage.
Because without the right intent, even the best CRO can’t produce sales.
Layer 2: Trust (They Didn’t Believe)
The intent may be right. The user may genuinely be close to buying.
But if sales still aren’t coming in, the most common reason we see is this: the user wasn’t unconvinced; they didn’t trust you.
The critical point in this layer is this:
The user wants the product, but perceived risk, in the end, outweighs perceived benefit. And this usually doesn’t happen loudly; they leave quietly.
A trust problem isn’t as simple as “no reviews”.
Visibility, timing and context are what it’s about.
- Trust signals exist but aren’t visible: Many sites have return, shipping, company or payment security information. But the user reaches it after the moment of decision — yet trust signals should work before the purchase button.
- Trust breaking down in behavioral data (project example): In one e-commerce project, this is what we saw:
- Add-to-Cart Rate was healthy
- Checkout Start Rate wasn’t bad
- But the cart abandonment rate was very high
- The GA4 funnel pointed to the “checkout step”.
In the Microsoft Clarity recordings, users were seen:
- Moving the mouse back and forth on the checkout page
- Looking for the shipping and returns sections
- Scanning the page up and down again before leaving
So users weren’t leaving because they “didn’t want it”, but because they weren’t sure enough to go ahead.
- Payment security isn’t just a logo: SSL, bank logos or a “secure payment” label aren’t enough on their own. The user wants clear answers to these questions:
- Who do I contact if something goes wrong?
- Is the return process really easy?
- Is this company real, and who am I dealing with?
- The trust gap shows up faster in ad traffic: Users coming from ads don’t know the brand. That’s why in ad traffic:
- If there are add-to-carts but no purchases
- The problem usually isn’t the price, it’s the perception of the brand and trust
Mini checklist (evidence-based):
- Adds to cart but checkout starts are falling → Trust or surprise costs
- The user spends a long time on the checkout page and then leaves → Indecision / perceived risk
- Heavy mouse movement at the checkout step in Clarity → “I’m not sure” signal
- Returns, shipping and contact information come after the CTA → Trust that arrives too late
The mistake to avoid in this layer:
Thinking of trust as “extra content”.
Trust, in fact, is a precondition for conversion.
A user who doesn’t believe you disappears much faster than a user who wants the product.
Layer 3: Friction (They Couldn’t)
In this layer, the user already wants it and most of the time believes you.
But the sale still doesn’t happen. Because the issue isn’t persuasion, but the ability to complete it.
Friction is every extra step, every uncertainty and every small struggle a user runs into.
On their own they seem insignificant, but together they tell the user:
“This is too much hassle right now.”
- Is It the Product Page or the Cart That’s Losing You? (Telling Them Apart Is Critical)
Many projects with conversion problems make this mistake:
Every drop is assumed to be “the product page”.
But the data often shows:
- The product page persuades
- The cart and checkout flow wear users down
- Detecting friction with behavioral data (project example)
In one project, this is what we saw:
- Add-to-Cart Rate healthy
- Checkout Start Rate was noticeably low
- In the Microsoft Clarity recordings, users were seen:
- Pausing unnecessarily on the cart page
- Moving the mouse back and forth over form fields
- Leaving the page at the “Sign up / log in” step
- The user was convinced. But the process was too much hassle.
- Mobile friction costs more than desktop friction
On mobile:
- Small buttons
- Long forms
- Poor speed drastically lowers the conversion rate.
What’s tolerated on desktop means instant abandonment on mobile in the end.
- Surprise costs = invisible friction
If shipping, taxes or extra fees appear at the checkout step, the user feels deceived.
This is where trust and friction intersect, and the abandonment rate climbs fast here.
Mini checklist (evidence-based):
- Adds to cart but no checkout start → Friction is a strong candidate
- Mobile conversion far lower than desktop → UX / speed problem
- Heavy mouse movement over form fields in Clarity → A demanding step
- Mandatory account creation → A reason for silent abandonment
- Extra costs appearing late → Second thoughts at the moment of decision
The biggest mistake to avoid in this layer:
“The user has come this far anyway, they can put in a bit more effort.”
In reality, the user never wants to put in effort.
What they want is simple: A fast, clear and smooth checkout.
Layer 4: Offer / Value (They Wanted It, but It Wasn’t Worth It)
For a user who gets this far, the picture is clear:
They wanted it. They believed. They could do it.
But at the last moment, they thought: “Is this worth it?”
The critical difference here:
Users rarely say “too expensive” out loud.
They quietly say “I’m not sure” and leave.
- Price alone isn’t the problem
There are brands that sell the same product at a higher price and still sell more.
The difference isn’t the price, but how clearly the value is presented.
The user wants to see: “What do I get in return for this price?” - When value is unclear, risk grows (project example)
In one project, a high share of users made it all the way to the checkout page.
But conversion was still low. What we noticed after reviewing it was this:
- Product descriptions explained “what it is”
- But “who it’s for, which problem it solves and why it’s different” wasn’t clear
- The user wanted the product, but this sentence wasn’t completing itself in their mind:
“Yes, this is the right choice for me.” - Packaging and framing change conversion
A single price is a bare number.
A packaged offer, on the other hand, creates grounds for comparison:
- Who is it right for?
- What’s included, and what isn’t?
- In which scenario does it make sense?
- Without this frame, the user compares the price not with competitors, but with their own doubt instead.
- No decision comes until the risk is reversed
If the guarantee, returns, trial period or “we stand behind our word” message isn’t clear, the user doesn’t want to take on the risk.
At this point, a small trust element can make a big difference in conversion.
Mini checklist (evidence-based):
- User reaches checkout but doesn’t buy → The value isn’t clear
- Indecision between similar products → Weak framing
- No answer to “Why us?” → The price always looks expensive
- No guarantee / risk-reducing message → The decision gets postponed
The mistake to avoid in this layer:
“Let’s give a discount, maybe they’ll buy.”
But usually the problem isn’t the price; it’s what the price means.
Once the value is clear, the user doesn’t struggle to decide.
The 30-Minute Diagnostic Flow (The Brandaft Method)
This section has one goal:
to give an indisputable answer to the question “In what order should I look?”
The flow below applies whether the traffic comes from SEO, ads, social or direct.
What it asks of you isn’t setting up a new tool, but looking in the right order instead.
Total time: about 30 minutes.
- Step 0 — Reality Check (3 min): GSC vs GA4
Goal: Is what you think of as “traffic” really traffic, or a wrong expectation?
- If most queries in GSC are TOFU queries (e.g. what is, how to, example, what is it for)
- and in GA4 you expect BOFU (purchase) behavior
- This isn’t an SEO failure.
This is a mismatch between intent and message.
The user asked “what is it”; you said “buy now”.
Red flag rule:
High share of TOFU queries + product-page-focused CTA = Mismatch
- Step 1 — Segment the Traffic (5 min)
Goal: To see whether the problem affects everyone or appears in a specific place.
- By channel: organic / paid / social / direct
- By page: product, category, landing, blog
- By device: mobile vs desktop
- What usually emerges here is:
“The problem isn’t everywhere, just in a specific combination.”
- Step 2 — Find Where Users Drop Off (10 min)
Goal: Not guessing, but seeing it in the funnel.
- Was the product viewed?
- Was it added to the cart?
- Was checkout started?
- Where does it break?
- In this step, the problem layer becomes clear:
intent, trust, friction or the offer?
- Step 3 — Not a Heatmap, but a “Hesitation Map” (10 min)
Goal: The goal is to see not what the user clicks on, but where they hesitate on the page.
- Is the mouse hovering around the price area?
- Are they leaving before reaching the CTA?
- Is there back-and-forth movement over form fields?
- These signals show not that the user doesn’t want it, but that they aren’t sure — that’s the signal.
- Step 4 — Write 3 Hypotheses, Pick 1 Test (5 min)
Goal: Not trying to fix everything at once.
A simple template:
“If we change X, Y will increase, because Z.”
- Write 3 hypotheses
- Choose the one with the highest impact — just 1 to act on
- Test that one first
The power of this flow comes from this:
Before you try to solve the problem, it stops you from fixing the wrong thing.
The 7 Most Common Root Causes (With Diagnostic Context)
The causes below aren’t a “copy-paste list”.
Each one answers two questions: how to recognize it and what to try first in each case.
- Wrong Traffic (Intent Doesn’t Match)
Symptom: Traffic rises, sales don’t. Session duration is high, but there’s no action.
Evidence: TOFU queries dominate in GSC; add-to-cart is low in GA4.
Fix: Separate informational traffic from sales; build separate landing pages for BOFU queries.
Quick test: In TOFU content, change the CTA from “buy now” to “see the guide / compare”. - Landing Page Message / Ad Promise Mismatch
Symptom: The ad gets clicks, but there’s a quick exit on the page.
Evidence: High CTR + low checkout start rate.
Fix: Align the landing page’s above-the-fold message exactly with the ad’s promise.
Quick test: Change the landing page’s hero headline to match the main promise in the ad copy. - The Product Page Doesn’t Persuade (It Informs but Doesn’t Sell)
Symptom: The page gets read, but there are no add-to-carts.
Evidence: High engagement time + low add-to-cart.
Fix: Instead of describing features, add clarity on benefits, use cases and “who is it for?”.
Quick test: Add a “Who is this product right for?” block below the first screen. - Trust Signals Missing or Showing Up Too Late
Symptom: Adds to cart, but no payment.
Evidence: Long time in checkout + rising cart abandonment.
Fix: Make returns, shipping, contact and payment security visible before the CTA.
Quick test: Add a short returns/shipping guarantee next to the purchase button. - Cart / Checkout Friction (They Couldn’t)
Symptom: Checkout isn’t started or is abandoned halfway.
Evidence: Heavy mouse movement over form fields; abandonment at the sign-up step.
Fix: Guest checkout, shorter forms, one-page checkout.
Quick test: Temporarily remove the mandatory account creation step. - Weak Mobile Experience
Symptom: High mobile traffic, low mobile conversion.
Evidence: Low revenue per session and high abandonment on mobile.
Fix: Simplify speed, button sizes, readability and checkout steps.
Quick test: Make the above-the-fold CTA bigger on mobile and move the price up. - Weak Offer / Value Perception (They Wanted It, but It Wasn’t Worth It)
Symptom: Users who reach the checkout page don’t buy.
Evidence: Hesitation around the price; switching back and forth with competitors.
Fix: Frame the value with packaging, a guarantee and risk reversal.
Quick test: Add a “Why us?” or short guarantee message next to the price.
These 7 causes usually work not alone, but together at the same time. But the good news is: you don’t have to solve them all at once.
What really matters is seeing which one is actually having an impact in the right order.
At Brandaft, we use our data analytics approach for exactly this: not to produce reports, but to be able to make decisions. Because without the right data, there are no priorities; and without priorities, every improvement turns into guesswork.
48 Hours / 7 Days / 30 Days: A Conversion Recovery Plan
The goal of this plan isn’t to “fix everything”.
It’s to fix the right thing, in the right order.
In the Brandaft approach, data isn’t used to produce reports; it’s used to set priorities and nothing else.
That’s why the steps below move from the fastest wins to a long-term system.
- First 48 Hours: Quick Wins
Goal: Stopping silent losses without getting into major development work.
- Move shipping, returns and delivery information above the fold on product/landing pages
- Add 1–2 clear trust messages near the purchase button
- Check whether guest checkout or a shorter checkout flow is possible
- Increase the visibility of price and CTA on mobile
→ These steps usually make a measurable difference within the same week already.
- First 7 Days: CRO Sprint
Goal: Making controlled improvements on the pages with the most potential.
- Choose the top 3 pages by traffic to act on
- Review the headline, image set and placement of social proof
- Set up a single A/B test (CTA copy, trust block, price framing)
- Look at results by segment (channel / device)
→ The goal here isn’t speed, but learning.
- First 30 Days: Build the System
Goal: Not running into the same problem again and again.
- Build a channel-level intent map (SEO, ads, social)
- Re-match content, landing pages and the offer structure to that intent
- Set a measurement standard: not a “report”, but a decision dashboard
- Clarify which metric raises an alarm, and when
→ This is the stage that doesn’t leave conversion to chance anymore.
What this plan gives you:
Small touches buy you breathing room, the mid term brings learning, and in the long term you build control.
Where Does Conversion-Focused Digital Marketing Come In?
A conversion problem isn’t solely an SEO problem, an ads problem or a design problem.
The problem is whether these channels serve the same intent.
Conversion-focused digital marketing doesn’t aim to increase traffic; it aims to bring
the right traffic to the right page with the right message instead.
- SEO: It produces intent, not traffic. SEO isn’t just visibility.
- Informational queries → guides, content, comparisons
- Purchase-intent queries → landing pages, categories, products
Trying to serve every intent with the same page lowers conversion.
- Ads: A fast testing ground
Ad traffic is where intent is measured fastest.
- Which message works?
- Which promise creates drop-off?
- Which price framing is accepted?
Here, ads are a source not just of sales, but of learning for the brand.
- Social Media: Builds trust and context
Social traffic is often the first touchpoint. Users want to get to know the brand before they buy.
- Social content feeds trust
- The landing page shouldn’t waste that trust
- UX: Where everything comes together
UX isn’t just design; it reveals how much the user struggles — and speed, readability, the number of form fields and the checkout flow are a shared test for every channel. - What ties it all together: data and priorities
Channel-level success isn’t meaningful on its own. What matters is which channel works at which stage. A conversion-focused approach doesn’t pit channels against each other; it matches them.
That’s why conversion isn’t the job of a single team or a single tool. Digital marketing is a whole — and sales are the natural result of that whole.
Conclusion: Fix the System, Not the Traffic
The feeling of “we have traffic but no sales” wears you down.
Because there’s effort, budget and time — but no return. At this point, the problem often becomes invisible and control is lost.
But what we saw in this article was:
A sales problem is rarely a mystery. It usually looks unsolvable because it’s being looked at from the wrong place. From measurement to intent, from trust to friction, from the offer to the experience, everything is part of a chain. The moment you see where the chain breaks, panic makes way for clarity right away.
That’s exactly our approach at Brandaft.
Instead of promising more traffic, we focus on understanding why your current traffic isn’t producing sales — because sales aren’t magic; they’re the validation of a properly built system.
If you’re stuck in this loop:
- Traffic is coming in, but sales aren’t growing
- You don’t know which channel to act on
- You’re saying “something’s wrong, but where?”
you don’t have to solve it on your own.
If you’d like, we can run the 30-minute conversion diagnosis described in this article together. Instead of long reports, we’ll show you where you need to start with a short, clear action list.
Frequently Asked Questions About Traffic but No Sales
If there’s traffic but no sales, where does the problem usually start?
In most cases, the problem doesn’t start where you think it does. The first break is usually in tracking or in the intent of the incoming traffic. Incorrectly measured data leads to decisions that look right but don’t work. If there’s an intent mismatch, even the right traffic won’t produce sales. That’s why the diagnosis should always follow the order “data first, then behavior”.
Why does the conversion rate drop? What are the most common reasons?
The conversion rate doesn’t drop for a single reason; usually several layers are at work at the same time. Traffic with the wrong intent, weak trust signals, friction in the checkout steps and an unclear offer are the most common causes. On mobile in particular, small issues lead to big losses. That’s why you need to see not just the number, but where it drops as well.
What does it mean if there are clicks in GSC but no engagement in GA4?
This scenario usually points to two possibilities: a tracking problem or an intent–page mismatch. The user may not have found what they were looking for, or engagement isn’t being measured correctly. Event setup and tracking settings play a critical role here. The first diagnosis should always be the setup, not the content.
Why does cart abandonment rise, and how can you reduce it fastest?
Cart abandonment usually rises not because of price, but because of uncertainty. If shipping, returns, delivery time or payment security aren’t clear, the user gives up at the last moment. The fastest improvement is to make this information visible before the payment button. Reducing friction is more effective than trying to persuade.
Does TOFU traffic bring sales, and how do you connect it to BOFU?
TOFU traffic doesn’t bring sales directly, but if it’s set up right, it prepares the ground for them. The problem is putting early sales pressure on users who are looking for information. This traffic needs to be moved to the BOFU stage with guides, comparisons and intermediate CTAs. Trying to serve every intent with the same page lowers conversion.
Which matters more: Bounce Rate or Average Engagement Time?
No single metric is enough on its own. Bounce Rate gives a quick signal, but Average Engagement Time is more valuable for understanding whether the user was really interested. If engagement time is long but there are no sales, it usually points to informational intent. Reading metrics not one by one, but together is what leads to the right diagnosis.