
“We had our website analyzed and got a score of 87. But the phone still isn’t ringing.”
We hear this all the time. The score is fine. But the question is wrong. A website analysis doesn’t end with a single grade from a tool; it means reading crawlability, speed, user experience, the conversion path and the measurement setup together, and then ranking which problem is actually costing you money.
The numbers show why this distinction matters. According to HTTP Archive data, in 2024 only 43% of mobile websites passed all three Core Web Vitals metrics; on desktop the figure was 54% (HTTP Archive Web Almanac, 2024). And in a study commissioned by Google and conducted by Deloitte, a 0.1-second improvement in mobile site speed lifted retail conversion rates by 8.4% (web.dev, Milliseconds Make Millions).
So speed is not a technical detail. It is a line item that goes straight to revenue.
In this guide, we’ll cover:
- Why a website analysis goes further than an SEO check
- Where to start the analysis
- What to check in each of the five layers, and with which tools
- How to prioritize findings by impact and effort
- When an automated report is enough and when you need an expert diagnosis
At Brandaft, we read why websites don’t rank and why they don’t sell. We are an Istanbul-based SEO agency. When we look at a site, our first question isn’t “what’s the score?” but “which problem, once solved, will make the biggest difference?” That is what producing decisions instead of reports means.
What Is a Website Analysis? (And Why It’s Not Just an SEO Check)
A website analysis is an audit that evaluates a site’s technical health, speed, user experience, conversion performance and measurement accuracy together. The goal isn’t to produce a list of errors; it’s to find out why the site isn’t reaching its business goal.
An SEO check is one part of this work. It focuses on search engine signals such as meta tags, heading structure, keyword usage and links. A website analysis takes a step back and asks: what happens after a visitor lands on the site?
A website analysis maps the problem.
An SEO check examines one region of that map.
The distinction matters in practice. On a site where search traffic is growing but forms aren’t coming in, the problem usually isn’t SEO. The reverse is also true: if a perfectly designed page isn’t indexed, conversion optimization reaches no one. In the next section, we look at the order in which to run the analysis.
Where Do You Start a Website Audit? Goal First, Tools Second
Don’t start by opening a tool. First, write down in one sentence what the site exists for: is it collecting quote requests, selling products, booking appointments? That sentence is the yardstick that tells you which findings matter.
Then gather the data you already have. Search Console shows the search side, GA4 shows visitor behavior and PageSpeed Insights shows speed. A decision made without looking at all three together is only half a decision.
Are you getting traffic, or customers?
We build SEO around revenue, not rankings. Let's find where your site is losing and prioritise the fixes by impact.
GET AN SEO QUOTEOrder matters too. Speeding up a page that isn’t crawled is wasted effort; optimizing a form you don’t measure is work whose result you’ll never see. That’s why we recommend reading the five layers below from top to bottom. The first layer is the foundation: can Google see your pages?
Layer 1: Can Google Crawl and Index Your Pages?
The first checkpoint for technical health is the Page indexing report in Search Console (Google Search Console Help). It shows which pages are indexed and why the others were left out. If the “Crawled – currently not indexed” row is crowded, the problem may lie in content quality or site structure.
The main things to check in this layer: Is robots.txt blocking important sections? Is the sitemap up to date? Do canonical tags point to the right page? Are there pages returning 404s or redirect chains? We cover how to run these checks in our technical SEO guide in detail.
The pattern we see most often in the field: redirects forgotten after a site redesign and incorrect canonical tags. In a tool report they look like minor warnings, but they quietly erode the site’s visibility. The most common technical SEO errors are collected in a separate article. If the foundation is solid, you can move on to the second layer: speed.
Layer 2: Which Metrics Should You Use to Measure Site Speed?
Measuring speed with the question “how many seconds does the page take to load?” falls short. Google reads user experience through three Core Web Vitals metrics and publishes the thresholds it considers good: LCP (Largest Contentful Paint) of 2.5 seconds or less, INP (Interaction to Next Paint) of 200 milliseconds or less, and CLS (Cumulative Layout Shift) of 0.1 or less. These thresholds are assessed at the 75th percentile of page loads (web.dev, Web Vitals).
PageSpeed Insights shows these metrics from two different sources: field data from real users and a lab test. Prioritize field data when making decisions. A page with a lab score of 95 whose field data says “failed” is slow for your real visitors. On mobile, only 59% of websites reach a good LCP score (HTTP Archive Web Almanac, 2024); it’s most likely the first metric you’ll need to look at.
An honest note is needed here. Google states clearly that good Core Web Vitals results don’t guarantee top rankings and that search results always try to show the most relevant content (Google Search Central).
Speed is not a ranking guarantee.
But slowness loses you the visitors you’ve already won.
A fast site is useless if it doesn’t take users to what they’re looking for. That’s what we look at in the third layer.
Layer 3: Do Visitors Find What They Came For? (User Experience)
In a user experience analysis, the question is simple: with what intent did the visitor land on this page, and how many clicks does it take to reach it? The fastest way to find out is to open your five highest-traffic landing pages and look at them through a stranger’s eyes. Is the main message visible above the fold? Does the menu open on mobile? Does the form ask for more fields than it needs?
Heatmap and session recording tools back up this observation with data. Areas users try to click that aren’t links, scrolling that stops halfway down the page, a form field where people give up: each of these is a friction point.

The common mistake in this layer is judging the design by taste. “The page looks nice” is not a finding. A finding is: “On mobile, the quote button sits on the second screen, and a large share of visitors never scroll that far.” The second turns into a decision; the first doesn’t. Once the friction points are identified, the next question is more direct: why isn’t traffic turning into customers?
Layer 4: Why Isn’t Your Traffic Turning Into Customers?
A conversion analysis follows the path to the site’s business goal step by step. On a site that collects quote requests, that path usually looks like this: landing page, service page, form, thank-you page. Seeing how many people stay and how many leave at each step shows where the problem is.
Traffic ≠ demand.
If visitor numbers are rising while demand stays flat, the problem most likely isn’t the traffic itself but the path. Visitors arriving with the wrong intent, an unclear offer, missing trust signals or a long form are the four causes we see most often. We walk through this diagnosis step by step in our website traffic but no sales article.
Speed shows up again in this layer. According to the study mentioned in the introduction, a 0.1-second improvement in mobile speed increased conversion rates by 8.4% in retail and 10.1% on travel sites (web.dev, Milliseconds Make Millions). When you work on a conversion problem, put the findings from the second layer back on the table. But all of these calculations rest on the assumption that measurement is correct. The last layer tests that assumption.
Layer 5: Which Data Can You Trust If Tracking Isn’t Set Up Correctly?
Measurement is the most frequently skipped layer of an analysis. Events marked as key events in GA4 are the source of everything that appears as a “conversion” in your reports (Google Analytics Help). If the wrong event is marked, the whole report answers the wrong question.
An example from our own website: most of the events counted as form submissions in GA4 weren’t real quote forms, but forms from the free tools on the site. The number looked good, but it didn’t reflect real demand. In this layer, check: does each form submission trigger exactly one event? Are WhatsApp and phone clicks tracked? Is data lost entirely when cookie consent is declined? For the last question, cookieless conversion tracking with Consent Mode v2 is covered separately.
Once measurement is fixed, you’ll have a reliable list of findings. Now that list needs to be turned into decisions.
How Do You Prioritize Website Audit Findings? (Where the Real Work Begins)
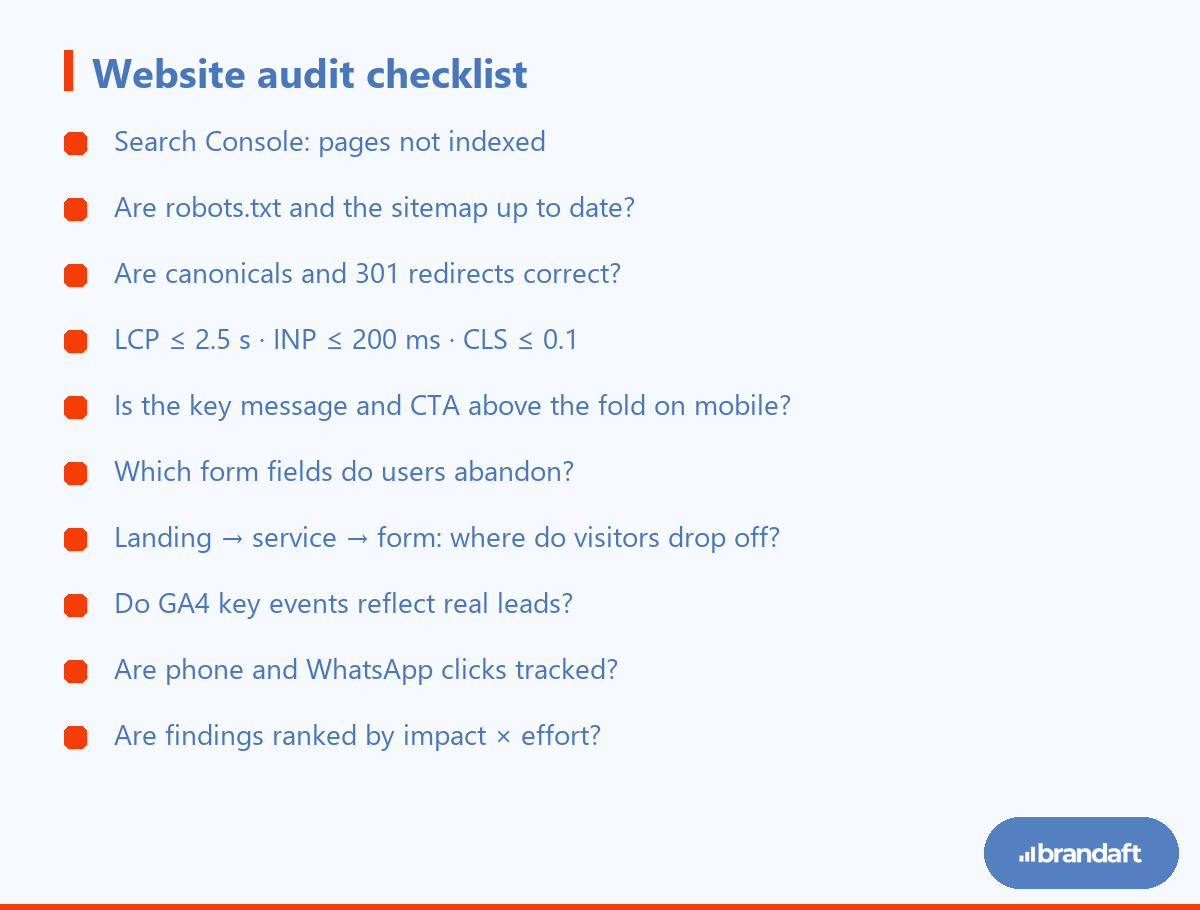
By the end of the five layers, you’ll have dozens of findings. Trying to fix them all at once means finishing none of them. Ask two questions about each finding: if it’s solved, how big is the impact on the business goal, and how much effort does it take? Findings with high impact and low effort go to the top of the list.
Automated tools do the first half of this work quickly. Brandaft’s free website analysis tool scans meta tags, page speed, robots.txt and the sitemap in seconds. But a tool tells you that something is missing; it doesn’t tell you which gap actually makes a difference in your industry.
A tool tells you what’s missing.
A diagnosis tells you what comes first.
Making that distinction requires someone to sit down and look at your site, your competitors and the search results. In our SEO diagnostic report, that’s exactly what we do: rank the reasons holding you back by importance and turn them into a prioritized ten-item to-do list.
Frequently Asked Questions About Website Analysis
Can you analyze a website for free?
Yes, most of the basic checks can be done with free tools. Search Console shows index and search data, PageSpeed Insights shows speed metrics and GA4 shows visitor behavior, all for free. Brandaft’s website analysis tool also scans meta tags, speed, robots.txt and the sitemap at no cost. The limit of free tools is that they don’t prioritize the findings for your industry.
How long does a website analysis take?
An automated scan returns results within a few minutes. An analysis that covers all five layers, interprets the data and prioritizes it takes a few days, depending on the size of the site. Our diagnostic report is delivered within three business days. What determines the timeline isn’t the tool; it’s turning the findings into decisions.
Is an SEO audit the same as a website analysis?
No, an SEO audit is one part of a website analysis. The SEO side focuses on search engine signals, meaning meta tags, content structure and links. A website analysis also examines speed, user experience, the conversion path and measurement accuracy. On a site that gets traffic but doesn’t generate leads, the problem usually lies in the layers beyond SEO.
What tools are used for a website audit?
The core set is Google Search Console, Google Analytics 4 and PageSpeed Insights. For large sites, crawlers such as Screaming Frog are added for technical crawling, along with heatmap and session recording tools for user experience. More important than which tool you pick is reading their data together. A single tool’s score isn’t enough to make a decision about the whole site.
How often should you audit your website?
Run a full analysis at least once a year, and always after a site redesign or a major design change. Checking Search Console and GA4 data monthly in between helps you catch problems before they grow. Speed metrics should be checked after theme, plugin or code updates. The measurement layer should be retested whenever a new form or checkout step is added.
My audit score is high, so why isn’t my site ranking?
Because an audit score measures only part of what drives rankings. Google states that even good Core Web Vitals results don’t guarantee top rankings and that the most relevant content always comes first. Rankings are usually decided by content depth, match with search intent and the authority gap versus competitors. Seeing that gap requires examining your site alongside your competitors.
Conclusion: Not a Score, but an Order of Priorities
A website analysis isn’t about glancing at a tool’s grade and feeling reassured. It’s about reading the crawlability, speed, user experience, conversion and measurement layers together and deciding which problem to solve first.
A score shows you where you stand.
An order of priorities shows you what to do.
There are two ways to see where your site stands: an automated report shows the gaps right away, while a full diagnosis tells you which one to fix first. On our free SEO report page, choose the one that fits you.